Embedded analytics have rapidly become one of the new “art of the possible” scenarios to add to a long-term business intelligence strategy. In a previous blog post, found here, we provided considerations for analytical leadership within primarily SAP-centric environments. This post intends to help business leaders understand what embedded analytics are and how they can drive action and data-driven decision-making throughout any team.
An embedded analytic is a dashboard, report or self-service tool (an analytic) encountered outside of its normal content repository or tool. Ideally, this analytic is encountered as close as possible to the moment when a decision or action is to be invoked in a business application. This has long been possible in software design scenarios, but what is new is the low/no-code approaches available today with standard analytic business intelligence (ABI) tools and platforms.
An embedded analytic is integrated directly into another application or website. Users should encounter this analytic while performing a different activity.

Embedded analytics aims to provide the right data insights to optimize a decision in the context in which this activity normally occurs. Think of a dog’s leash hanging next to the front door or a coffee grinder sitting next to the coffee maker. On the surface, we choose those locations due to convenience, but dig deeper and realize that this also drives behavioral change through increased adoption. This is half of the value that embedded analytics can deliver.
The other half can make you the life of the party. Visualize being at a dinner party and recalling the perfect joke. Or being in a great conversation and recalling the statistic or quote from that article you just read last week without having to break the flow and search on your phone. It’s the right information at the key moment, delivered as conveniently possible.
Let’s work through an example using a cut or fill rate analytic in a typical consumer goods or manufacturing company. The purpose of the cut or fill rate analytic is to provide insight into the service level between an organization and a customer. It identifies “cuts” or the deviations between what a customer has requested and what is needed to fulfill the request. For example, if a product is out of stock, it would be a cut.
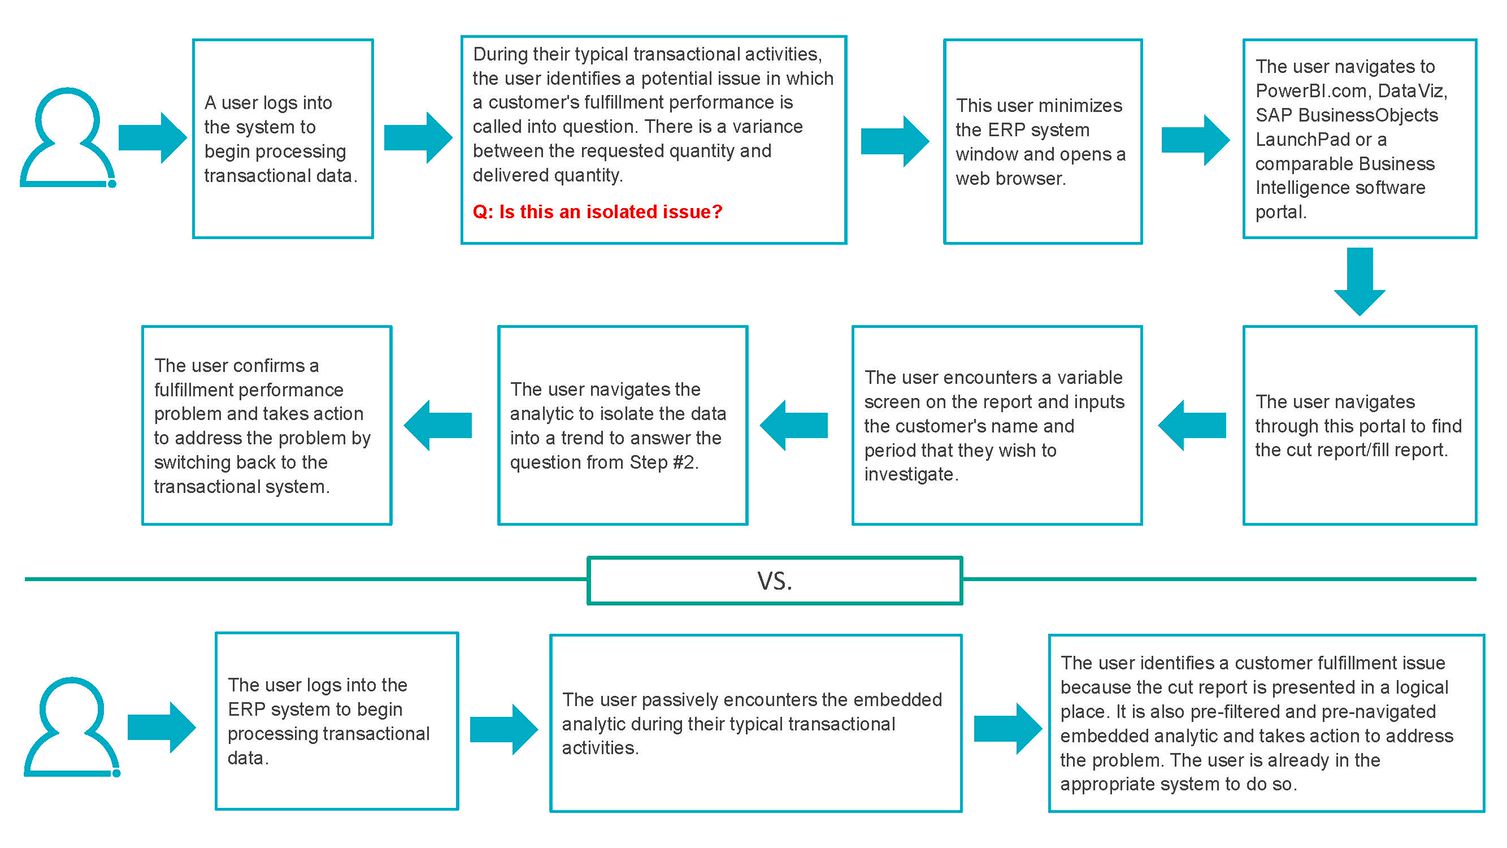
Now, consider embedded vs. traditional analytics from a step-by-step workflow perspective. Please note that this example is illustrative and will deviate from one organization to another.

The value should be clear from the illustration – the analytic is streamlined into the decision-making workflow in a natural way. However, the existing analytics may not be mature enough to provide the expected value from this approach today. Remember, over time, analytic content should mature toward use-case driven scenarios. This requires a strong understanding of actions available or expected from users and the steps that they go through to gather information. This type of analytic is referred to as a guided navigation dashboard. A guided navigation dashboard follows a design principle in our framework: “WITNS,” pronounced “Witness,” meaning What is the Next Step?
A guided navigation dashboard should fully answer the user’s information requirements. If the options require additional information to make a decision, the dashboard can navigate to that information. All data needed to make the key decision should be available to the user, most of the time. When the dashboard falls short, the root cause should be understood so the dashboard can be enhanced.
Returning to the cut and fill rate example, consider the following ideas:
- Could a different product be substituted for the requested one? If so, the WITNS may be to identify these complementary materials as well as the available quantity on-hand.
- Could an inventory transfer be initiated to source the materials from another location or warehouse? Could a different location satisfy the order? The WITNS may be to display the costs of those transfers as well as materials on hand at those locations.
- Could the manufacturing production schedule be adjusted to create this product? The WITNS may be to understand the current schedule, financial and human impacts of changing it, and other options.
- Could we simply cancel or fail to provide the material to this customer? Do they have recent customer service complaints? How frequently has this happened to this customer and should we offer a proactive loyalty incentive?
After understanding the action paths, the next step is to understand what information would assist in determining the appropriate action. In this example, the larger financial and service level impact across customers may be necessary information. This style of thinking can lead to a recommended action on the analytic. A recommended action found on a dashboard is an indicator of a very mature analytic.
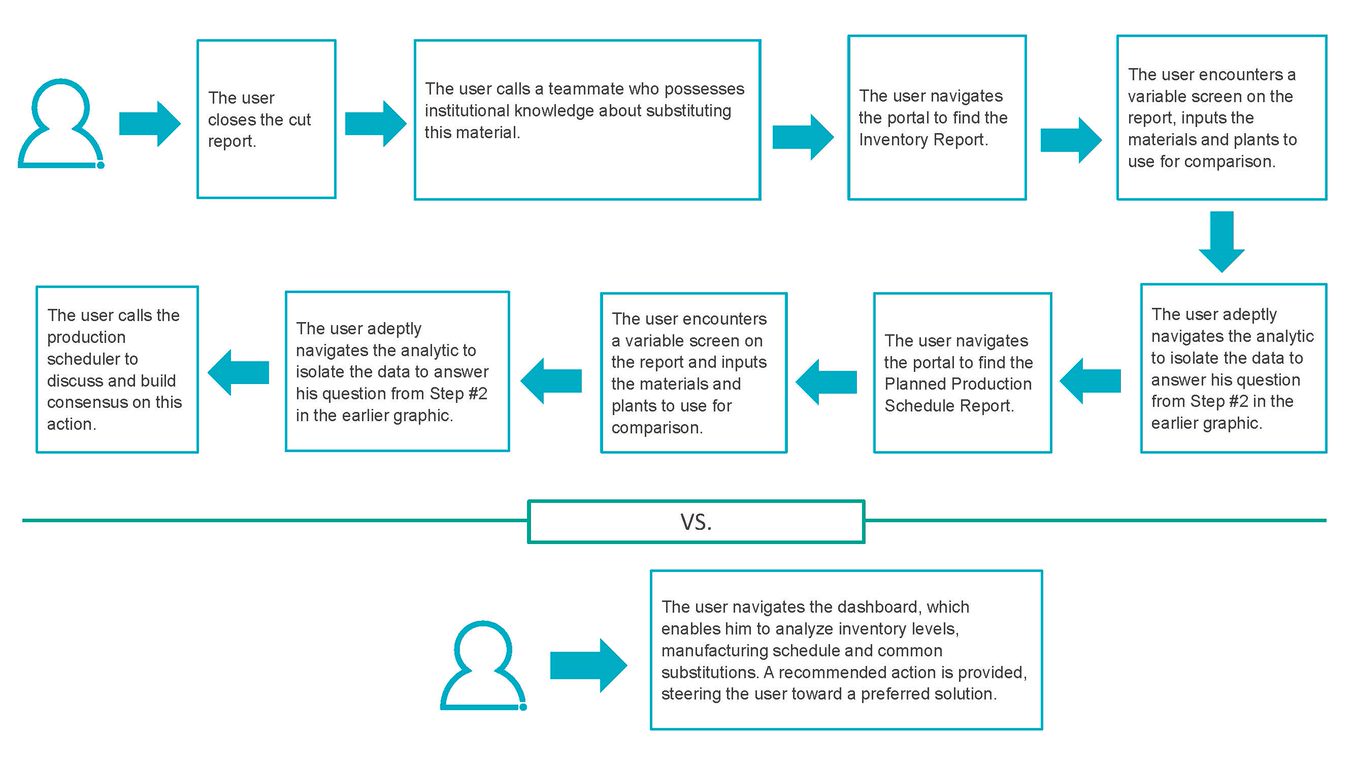
Look again from a workflow perspective, this time beginning with the final step in the earlier process.

Business leaders may not be able to visualize the application screens and analytics capabilities required to step through the decision-making process and achieve these goals. This is common, so share this post with your team’s analytic power users and system analysts and challenge them with advancing these capabilities. If additional assistance is needed to improve analytics capabilities, Protiviti’s analytics experts have developed an analytics framework that can assist with embedded analytics or improving toward guided navigation dashboards. Protiviti can also support technology teams with the technical integration to enable embedded analytics.
To learn more about our enterprise data and analytics services, contact us.


