As part of a typical business intelligence program, organizations are bound to take advantage of multiple systems. One system may provide exceptional reporting capabilities. Another may provide best-in-class dashboarding. Yet another may provide outstanding predictive abilities. The challenge is understanding where and how to access multiple systems in a business intelligence landscape. This is where hybrid analytics becomes necessary.
Hybrid analytics is an architecture that combines business intelligence systems that are both on-premise (housed within an organization’s data center) with those that are cloud based. Because analytics can be developed through multiple business intelligence platforms and stored in different locations, discovery of useful analytics can be difficult. The hybrid analytics system removes the need to remember where a report or visualization is stored. There is power in combining platforms that are currently in place with a unified location that provide cutting edge capabilities.
The foundation of hybrid analytics is an accessible data visualization. This is usually delivered via a server-based platform such as Tableau Server, Power BI Server or SAP Analytics Cloud. All the major business intelligence platforms have enabled the foundation of hybrid analytics by using a specifically-generated access URL. Generally, organizations are faced with one of three challenges that lead to an investment in hybrid analytics:
- Unifying multiple, disparate systems
- Reducing end user confusion
- Modernizing in-house analytic capabilities
Unifying Multiple, Disparate Systems
Multiple systems will typically be used to deploy a range of business intelligence insights. Usually, these are a series of desktop applications that can publish to a central server. Tableau Desktop/Server/Online and Power BI Desktop/Server are examples. Alternatively, online-only systems, such as SAP Analytics Cloud, are also available.
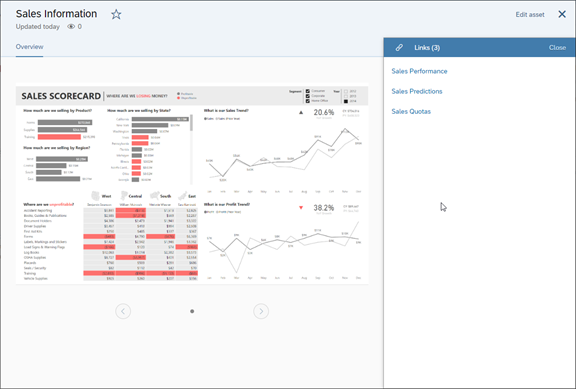
Once visualizations are published to a server and made available to end users, confusion may arise on where to find what type of data or information. Hybrid analytics resolves this problem by providing a single web-based interface that provides links to multiple systems. The focus of hybrid analytics is the nature of the information. Take, for instance, a sales system. Sales performance data may be kept in Tableau Server while some sales predictive visualizations may be available in SAP Analytics Cloud and sales quotas may be available through Power BI Server. Using a hybrid analytics system, we can see a single sales section with multiple links. A sales end user accessing the hybrid system would only see screen shots along with links, not knowing that clicking on the three different links takes them to three separate systems.
Reducing End User Confusion
Accessing multiple systems can be time consuming and confusing for some end users. As mentioned above, a URL is published that provides the locations for the desired analytics. It is up to the end user to keep track of the URLs in their browser. Alternatively, a company may provide direct access to the URLs through an internal portal such as SharePoint or a custom developed intranet site.
Such internal sites are another example of a hybrid analytic system. Recall that the definition of a hybrid analytic system refers to any available system that has an ability to expose business intelligence assets while hiding the complexity of the architecture. A listing of links in SharePoint would certainly fulfill this need by providing a listing of links relating to a business topic.
Modernizing In-House Analytic Capabilities
Rebuilding existing analytics is a time consuming and sometimes cost prohibitive endeavor. If a report or dashboard works well and provides insight, there may be no desire to change it. Any report or dashboard that does not provide insight will go unused and will likely be updated, deleted or forgotten. The assets used can benefit from a hybrid system through becoming the target of a more modern type of interface.
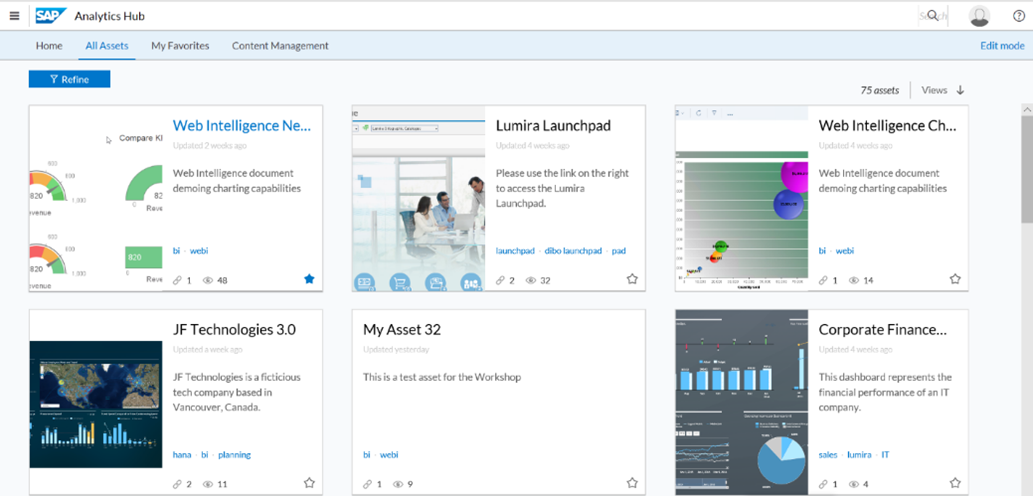
Paginated reports, while useful, can be quite boring. Some data visualizations suffer from overuse of colors or unnecessary effects (remember 3D pie charts?). If we use a hybrid system such as SAP Analytics Hub, we can present screen shots that showcase the most attractive data visualizations while linking back to tried and true information assets. Providing a new face on an older system can breathe new life into it, energizing existing users and potentially attracting new users.
Getting Started
Let’s now define the steps to building a hybrid system. First, take an inventory of the reports and visualizations are currently in use. Where are they kept? Are there paginated reports in SAP Web Intelligence hosted in the SAP BusinessObjects system? Is there a range of published PDFs in a directory that come from a SAS system? Have cool new visuals in a Tableau Server been incorporated on the corporate intranet? List all the visualizations that are currently used and work to identify how they are accessed.
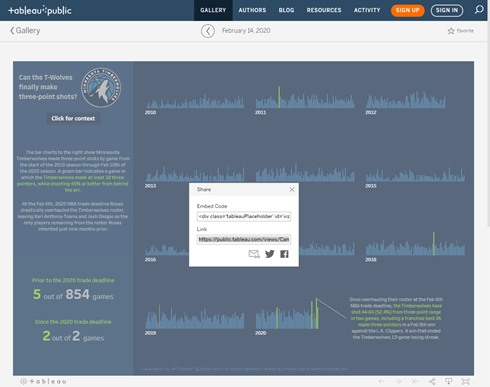
For instance, Tableau Public, a publicly accessible instance of Tableau Server, provides URL access to its shared visualizations.
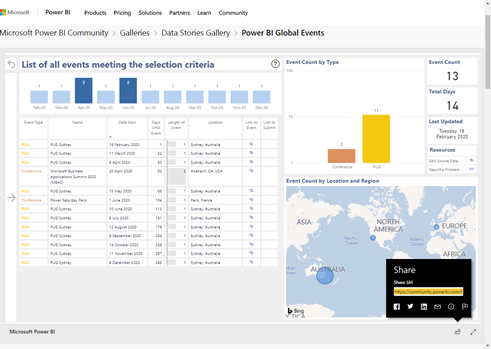
The Power BI Community also provides access to a series of visualizations. Each of these visualizations are also accessible via URL.
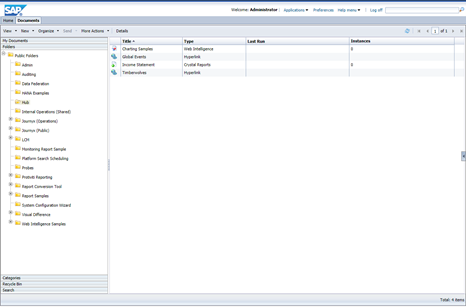
To build a hybrid analytic system, we use these two URLs within a common platform of our choice. Some of our clients use their own intranet site. Others use solutions such as SAP BusinessObjects or SAP Analytics Hub. We have had hybrid analytic capabilities in SAP BusinessObjects for years. Within folders, we can add hyperlinks to other resources such as web pages, documents and web services. The issue here is that the interface does not have a modern look. However, it is functional and may already exist in the business environment.
More modern interfaces such as SAP Analytics Hub provide the ability to generate images that are appealing and are easy to understand and interpret.
Security
Security structures of the underlying systems (i.e. Tableau, Power BI, SAP) still hold because once the user clicks the link, they are still challenged for their credentials in those systems. If these systems take advantage of single sign on or automatic token generation, then the user will be automatically authenticated and the visualization will appear. Otherwise, users will need to enter valid credentials to see these visualizations.
It is possible to still apply security on the hybrid system. On systems such as SharePoint, SAP Analytics Hub or a custom system, users can be added and removed as security requirements change. This does not change the security of the system that contains the business analytics, it just controls who has access to see the links that will provide access. The user will still be authenticated into the underlying system.
Conclusion
Hybrid analytic systems do not have to be fancy and do not have to be expensive. Organizations may already own a portal within which hyperlinks may be added in a single location that point to different systems (i.e. SharePoint, SAP BusinessObjects Launchpad). The key is understanding how information in the daily workflow is currently accessed. Pull together those reports and visuals and check to see if they are accessible by a hyperlink. Add the links under a logical grouping like sales or finance and see how they flow together. Maintaining hyperlinks or multiple desktop applications may be a thing of the past once a good hybrid analytics system is established.
To learn more about our SAP capabilities, contact us or visit Protiviti’s SAP consulting services.


