


In the fast-paced world of software development, staying ahead of the curve requires more than just coding prowess. Agile methodologies have emerged to provide a structured framework for teams to navigate the ever-changing landscape. Yet, given Agile’s emphasis on adaptability and continuous improvement, presenting real-time insights into project progress remains challenging for many teams. This is when the power of building automated burndown charts with Microsoft DevOps Analytics View and Power BI truly shines.
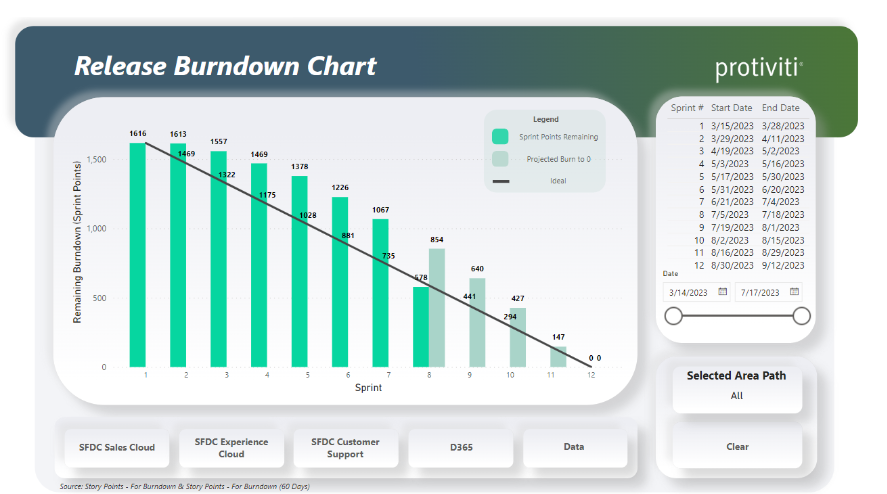
Generated screen for reporting mid sprint eight story point burndown progress. Filterable by area path and date. Showing improved story points earned velocity from sprint seven and progress toward project completion.
Business benefits
Real-time insights: Automated burndown charts provide business teams with real-time visibility into project progress, enabling them to make informed decisions promptly. With up-to-date data at their fingertips, teams can identify potential bottlenecks, adjust priorities and allocate resources effectively to ensure project success.
Improved transparency: By leveraging Microsoft DevOps Analytics View and Power BI, business teams can promote transparency across the organization. Accessible and easy-to-understand burndown charts facilitate open communication, foster collaboration and build trust among team members, stakeholders and leadership.
Enhanced predictability: Automated burndown charts enable business teams to forecast project timelines and outcomes more accurately. By tracking trends and historical data, teams can anticipate potential challenges, mitigate risks proactively and optimize their approach to achieve predictable delivery of products and services.
Efficient resource allocation: With insights derived from burndown charts, business teams can optimize resource allocation and prioritize tasks effectively. By identifying areas of underutilization or overcommitment, teams can reallocate resources strategically, streamline workflows and maximize productivity across projects.
Data-driven decision making: Leveraging Microsoft DevOps Analytics View and Power BI empowers business teams to make data-driven decisions based on key metrics such as velocity, sprint progress and backlog trends.
Building automated burndown charts with Microsoft DevOps Analytics View and Power BI equips business teams with the tools and insights necessary to optimize project management processes, foster collaboration, and drive business success.
Getting started
- Connecting Power BI to Microsoft DevOps:
- Launch Power BI and navigate to the “Get Data” section.
- Select “Online Services” and choose “Azure DevOps (Boards only)” as the data source.
- Input the organization’s URL (e.g., “https://dev.azure.com/organization-name”) and the project name.
- Authenticate and connect to the DevOps account to retrieve relevant data.
- Building a data model:
- Identify the necessary data entities, such as work items, sprints and team assignments, to include in the data model.
- Create relationships between different data tables within Power BI to establish connections and enable comprehensive reporting.
- Define calculated columns and measures to derive additional insights from the data, such as velocity and remaining work.
- Modeling data for burndown charts:
- Structure data to support the creation of burndown charts by organizing it into relevant categories, such as work items, dates and progress tracking.
- Calculate key metrics, such as total story points completed and remaining work, to visualize sprint progress accurately.
- Use data analysis expressions (DAX) formulas to calculate cumulative metrics and forecast trends for informed decision-making.
- Adding interactive filtering for multiple teams’ needs:
- Incorporate interactive filtering functionality into the Power BI report to accommodate multiple teams’ needs.
- Create slicers or dropdown menus that allow users to filter data by team, area path or other relevant criteria.
- Customize the filtering options to provide a tailored experience for different stakeholders, enabling them to focus on specific subsets of data.
- Sharing the model through Microsoft Teams:
- Publish the Power BI report to Power BI Service and configure sharing settings to make it accessible to relevant stakeholders.
- Embed the Power BI report directly into Microsoft Teams channels or tabs to facilitate easy access and collaboration.
- Encourage team members to interact with the report, ask questions and provide feedback directly within Teams, fostering a culture of transparency and collaboration.
Unlocking valuable insights
Microsoft DevOps Analytics View and Power BI integration offers organizations a powerful platform to gain insights, drive continuous improvement and elevate their DevOps practices. By leveraging DevOps Analytics View’s comprehensive analytics capabilities and Power BI’s advanced visualization and analytics features, organizations can unlock valuable insights, optimize DevOps processes and deliver high-quality software faster and more efficiently.
To learn more about our Microsoft solutions, contact us.