The most important use of any risk assessment tool is that it must contribute to better decision making on how to manage individual risks. Whether that is treating and reducing risk, or accepting that risk exists, risk management activities must ultimately help management make better decisions. Executives and risk management leaders, though, are increasingly faced with risk decisions they have imperfect information to address, particularly in the form of “black swan” events.
The term “black swan” event was originally coined in Nassim Nicholas Taleb’s book, The Black Swan: The Impact of the Highly Improbable, which set the original criteria for these wildly unpredictable, yet highly impactful events, as:
- it must be surprising and unexpected
- it must have a major impact, and
- with the benefit of hindsight, it can be rationalized as something that should have been obvious.
Cyber Risk Quantification (CRQ) and, in particular, the Factor Analysis of Information Risk (FAIR) approach, was built as a decision-making framework and can help address the problem of analyzing even rare or unexpected cyber risk events. Using CRQ helps understand and analyze these events by allowing analysts to compare risks more effectively. For additional information on how to leverage FAIR, take a look at some of our earlier Protiviti blogs and whitepapers for examples.
Hunting for the “Black Swan”
According to the Cyentia Institute’s recent IRIS 2022 whitepaper, while the median, inflation-adjusted dollar loss associated with breaches is not significantly changing, the losses associated with the more extreme events have been trending upward over the last several years. It may be that increasing interconnectedness of organizations and criticality of technology to operations has expanded the upper range of loss potential, which in turn increases the potential for “black swan” events.
Recent or potential “Black Swan” events
- The COVID-19 pandemic – While pandemics are a consistent part of human history, the convergence of this virus with rapid technological advances in remote work capabilities, societal attitudes and the continued fallout for markets and the supply chain could certainly qualify.
- Cyber attacks on critical infrastructure – While often conceived of and discussed, we may not yet be able to contemplate the truly system-wide and outsize impact of a cyber attack of this scale. Consider an attack on a major cloud provider that takes down or fundamentally alters the ability of banks or healthcare organizations to continue operations due to systemic reliance on major providers.
- Post-quantum risk – While we know what is likely to occur (thus somewhat disqualifying it as a true “black swan”), at a geopolitical, industry and firm level there is significant uncertainty related to the potential major impacts.
Not all swans are black
While the term “black swan” is used often, a risk management practitioner should differentiate between the truly unexpected, and those events that are rare but conceivable (“gray swans”) but must consider both.
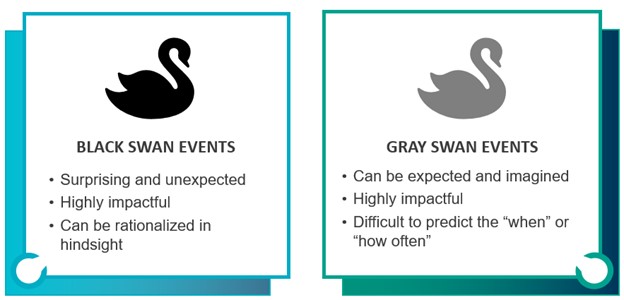
Image source: Microsoft
The below are cyber risks that get a lot of attention (rightfully so) but would more likely be considered “gray swans.”
- Most individual zero-day vulnerabilities, like the 2021 vulnerabilities affecting Log4j. Zero-day vulnerabilities are identified frequently and their impacts, while significant, generally have similar impacts and mitigations.
- The ongoing expansion of ransomware threats and ransomware-as-a-service. Ransomware has been around for many years, and the possible impacts were clear. This may be an “elephant in the room” – but not a “black swan.”
Organizations must deal with a flood of new risks, some of which could be considered potential “black swan” events, all the time. Organizations often rely on their risk assessment process to intake and evaluate these scenarios, which could occur on an annual or quarterly basis or even more frequently depending on the organization’s culture. When focusing on potentially catastrophic or extreme events, a routine risk analysis process can be adapted as follows:
Understand critical assets
The first step of any risk analysis is to understand assets of business value and the most probable threats to those assets. When considering business resiliency, organizations need to think bigger than single systems or servers. Organizations need to consider business processes as potential assets as well, such as the “Order to Cash” cycle or transaction processing capability of a wire transfer system. It is possible to leverage existing ERM, audit or asset management tools to identify assets of business value critical to the organization’s strategic objectives.
Focus on probable threats
After identifying key assets, we can complete FAIR-based analysis of potential loss scenarios to these assets and visualize scenarios that have a potentially significant average annualized loss. We can see immediate payoff by strengthening controls that mitigate these risks or adopting other risk responses. When focusing on most likely risks only though, there could be more impactful risks we are ignoring.
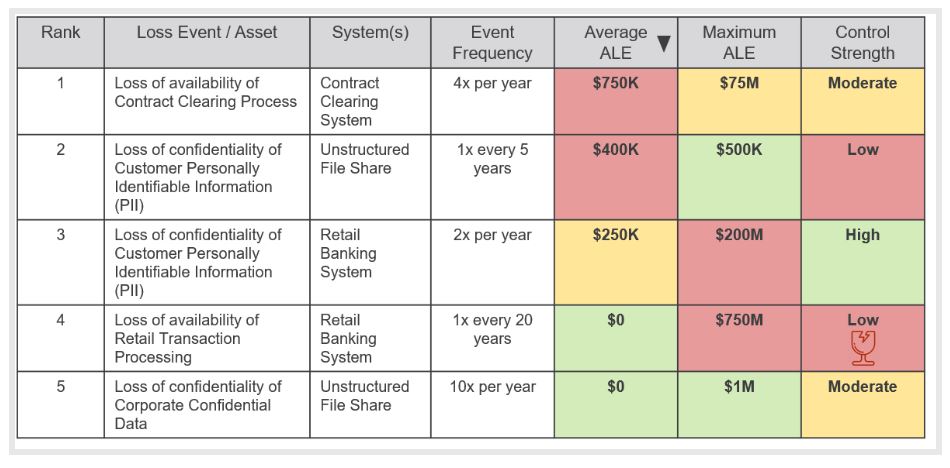 Figure 1 – Viewing “average” loss
Don’t forget the possible
Often in risk management, we come across the question of how to present low frequency, high impact events, like #4 in the above table with a maximum loss of $750M in a single year. If a $750M loss could result in this organization going out of business or have wide-reaching organization impacts, the fact that only a single control is in place to mitigate that risk should be understood. Using a quantified risk register, we can identify these risks as “fragile” – where risk is low only because a single preventive control is mitigating a large potential loss event (see the shattered glass icon). Senior leaders can then make an informed decision as to their comfort with this type of low likelihood, high impact loss event and what additional actions should be taken to address.
If our risk register can’t easily identify high potential risks without adequate controls (see view in Figure 2 for a resiliency focus), we are missing half the picture.
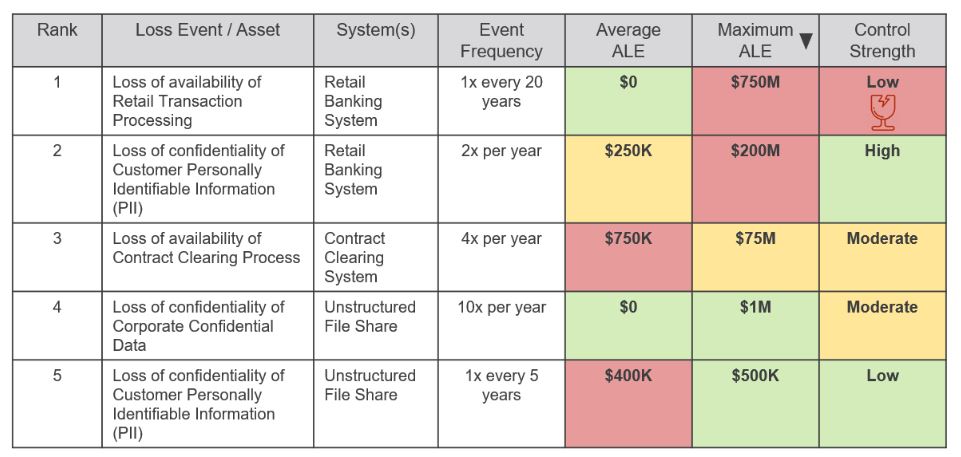 Figure 2 – Visualizing resiliency risks
Limit losses
We’ve all seen some great 2,000-line spreadsheets of different risk issues, but how can we get meaningful results by analyzing every issue of which the organization is aware? A data-driven approach showing what is likely to happen to our critical assets can also help inform us on the worst-case outcomes that could impact critical assets. When we can see individual scoped loss event scenarios, we can start to model alternative scenarios, but how can we bring controls into the model better and make meaningful comparisons between risk treatment options?
How FAIR-CAM works
What had been previously missing from FAIR analysis was a structured way to relate controls (and their effectiveness) to the FAIR model, and ultimately automate the process. In 2021, the FAIR Control Analytics Model (FAIR-CAM) was released, which introduced a method for relating controls and control effectiveness to individual FAIR loss scenarios. This model further allows us to visualize where single controls or only ineffective controls are in place, which can be easily updated with cyber assessment results to continue surfacing potential resilience risks. The model allows us to first link controls to each other and utilize them as inputs to estimations of FAIR scenario inputs (such as threat event frequency or vulnerability). See Figure 3 below for an example mapping.
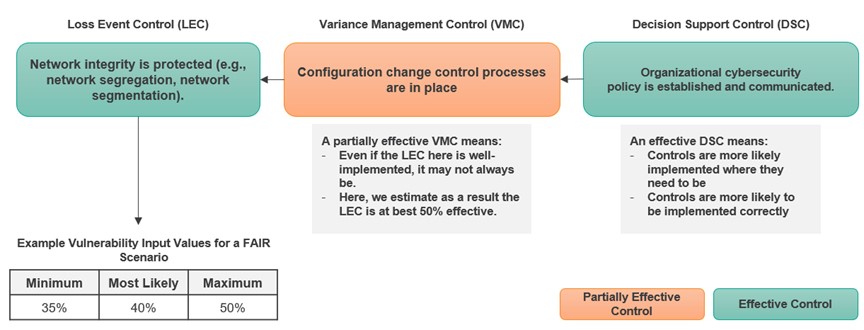
Figure 3 – FAIR-CAM and linkages to threat scenarios and the NIST Cybersecurity Framework (NIST CSF)
How we treat risk
With this model, we can quickly and regularly analyze many scenarios and evaluate risk treatment options. If the goal is to reduce day-to-day risk exposure, we can focus mitigation on high average ALE scenarios. When focused on resiliency, we can focus on 90th+ percentile ALE or even maximum ALE (our black and gray “swans”).
Visualizing this in Figure 4 below, an organization may initially focus efforts on addressing risk #1 with a high average ALE of $750K. Compare that to risk #2, which has an average ALE of $70K because it happens so infrequently, but ultimately has a maximum firm-ending loss potential of $750M (10x that of risk #1) and is identified as “fragile.” From a resiliency perspective, we should focus on reducing this maximum loss when given these two alternatives, which we can visualize better using risk quantification.
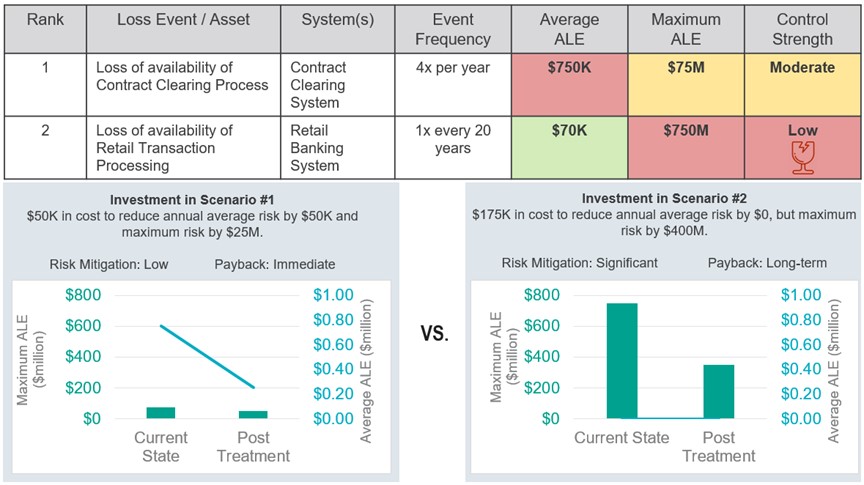
Figure 4 – Comparing risk treatment options
Understanding catastrophic risk
When evaluating these risks, organizations need to invest in quantitative risk analysis to truly understand which of their risks are most catastrophic. While this is the goal of many cyber resiliency programs, many use highly qualitative estimates or simplistic tools to describe this risk.
Organizations are being asked to more clearly “show their work” by regulators, and a proven, transparent and open-source framework like FAIR and FAIR-CAM can help. Organizations need to proactively identify areas where control gaps or deficiencies are increasing the organization’s susceptibility to catastrophic losses, which can also be used as an input into their ERM capabilities to better manage risk overall using NIST IR 8286 guidance. Organizations must anticipate and quickly learn from threat events to improve in the face of potential resiliency threats.
Read the results of our new Global IT Executive Survey: The Innovation vs. Technical Debt Tug-of-War.
To learn more about our cybersecurity consulting solutions, contact us.


