Enterprises across multiple industries and domains are increasingly turning to graph analytics, thanks to its power to uncover complex non-linear patterns and relationships in a dataset, which would not be easily visible or apparent using most traditional analytics techniques. Applications of graph analytics is wide-ranging, including customer relationship management, social network analysis and financial crimes detection – to name just a few examples. With the advancement of computational platforms and corresponding software, enterprises have huge opportunities to leverage graph technology to create competitive advantages over their peers.
What are the benefits of graph analytics technology?
Stanford University’s associate professor of computer science Jure Leskovec has said that graphs are a general language for describing and analyzing entities with relations/interactions. This is indicative of the fact that it is important to represent data in the native form that reflects its complex and nested relationships. Traditionally, data is stored in two-dimensional tables using rows and columns with predefined relationships to represent its context. However, complex relationships such as social, regulatory and banking customer relationship networks, are better to organize, store and analyze in graph data solutions as they natively represent their relations and interactions among entities. Comparing these graphics illustrates this point.
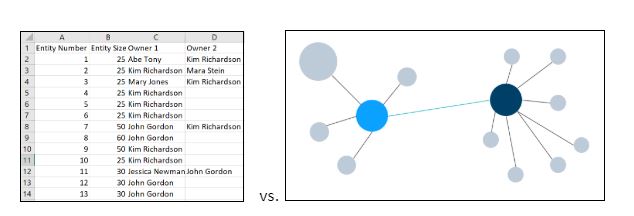
The graph model diagram on the right describes much more clearly the interactions among the entities than the two-dimensional table on the left. The graph clearly shows that all the entities can be grouped into two clusters and two key influencers are present. As the network grows bigger, it is much easier to generate complex insights from a graph data solution, which would not be accessible in a traditional tabular representation.
In addition, relational graphs can be used to represent complex domains that have a rich relational structure. By explicitly developing machine learning model(s) utilizing the relational structures uncovered by graph analytics, enhanced insights and model performance can be achieved.
What makes up a graph database?
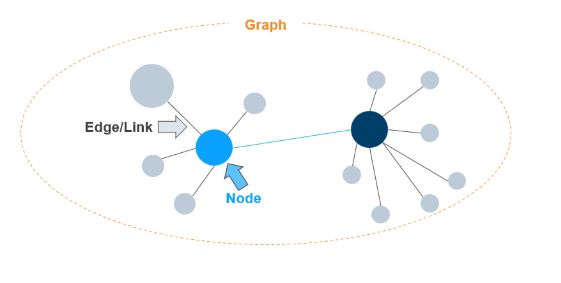
The basic components of graph data are node, edge/link and graph. Entities can be represented as nodes and the connections between entities (e.g., ownership, sharing address, email, phone numbers, etc.) can be represented as links or edges. In the example graph diagram shown below, the solid circles are nodes, and the lines connecting them are edges. Entire collections of nodes and edges can be represented as the graph. There could be multiple collections of nodes and edges or a graph in a domain. A graph can be either directed or undirected, depending on whether the edges have directionality. For example, a social media network that allows users to “follow” other users is an example of a directional graph – just because user A follows user B, user B does not have to follow user A. Additionally, a graph can also be weighted – where the link (edge) between any two nodes has a weight, reflecting the strength of the connection.
How are enterprises using graph analytics today?
Graph analytics is being used in a broad range of industries for a variety of applications. Example use cases described below provide a glimpse of the graph analytics landscape.
Customer and sales relationship management: By understanding the relationships among their customers, an enterprise, such as a bank, can target its sales efforts more effectively to achieve a higher ROI. Banks can optimize their sales and relationship management resources within the local network (a collection of bank accounts) by targeting key influencers (e.g., account with highest balance, account holders with a high percentage of ownership with other companies, etc.), consolidating marketing efforts if two or more sales relationships (local networks) share similar attributes, and divide and conquer if the sales relationship (local network) is too big.
Social network analysis: Social media companies are using graph analytics extensively to identify key influencers and interactions amongst themselves to gain competitive advantages over their competitors. Using the insights about their users, as revealed by graph analytics, they can create executable business strategies more effectively.
Financial crime detection: Perpetrators of financial crimes such as money laundering try to hide the origin of ill-gotten funds using multiple techniques. Graph analytics can quickly reveal connections between known financial criminals or sanctioned entities and seemingly innocent customers – surfacing suspicious transactions which would otherwise go unnoticed.
Biological/clinical research: Graph analytics is being used in several research areas, e.g., predicting a protein’s 3D structure based on its amino acid sequence (nodes are amino acids in a protein sequence and edges are proximity between amino acids). Knowing the 3D structure of proteins can help scientists, for example, in drug discovery.
Marketing: Patterns revealed by graph analytics in a user/customer database can be used to develop more effective marketing, e.g., product recommendations – songs, movies, retail purchases, etc.
Considerations for successful implementation
Aligning business operations to graph is essential for the successful implementation of graph analytics in an enterprise’s operations. It can be a significant effort to translate business operations into data points that represent nodes and edges in Graph Theory. For example, if we want to represent a banking transaction as a graph, a node can be any entity that makes deposits, receives deposits, guarantor, signer, etc. An edge can be a directed link from the entity that makes deposits to the beneficiary of the deposit, or other types of transactions. The data representation grows significantly if there is no thoughtful process to filter the relevant entities and transactions or linkages. In addition, there may be special cases or exceptions that may need human intervention.
Data quality is another key element of success. Graph is a data-driven approach to represent relationships. If the underlying data is not correct or consistent, the insights generated from graph analysis can be adversely affected.
Computational resources are another important consideration for enterprise-level implementation. The data representation of a network can be very complex as it may have arbitrary data size and a complex topological structure. Graph data often have dynamic and multimodal features that span different levels (node/edge/graph) and contexts. As an example, the features in a banking dataset may include different types of bank account holders (node level), means of transaction (edge level), amounts of transactions (edge level), and legitimacy of transactions (suspicious or not) within the local network (graph level) as well as within the same system. Complex computations and mathematical estimations require intensive computational resources to accomplish these challenging tasks.
With the advancement of computational platforms and corresponding software, enterprises have huge opportunities to leverage graph technology at scale to create competitive advantages over their peers and to gain deeper insights available within their own data.
To learn more about graph technology and other emerging technology solutions, contact us.