


Integration of SAP SAC and other third-party reporting capabilities
Based on our experience gained during many SAP governance, risk and compliance (GRC) implementations over recent years, we know that clients are always looking for more flexibility and visualizations to meet their internal reporting requirements. While SAP GRC provides comprehensive reports, these are table-based with limited visualization capabilities. As a result, most customers opt for alternative solutions using Microsoft Excel or other report visualization and dashboarding applications.
In this context, we are often asked to help develop “fancy” reporting. But what does that mean? Is a “fancy” report also a good report? How does a new interface help to achieve the best solution?
We discussed the topic with our colleagues from Protiviti’s data and analytics team and developed five major themes that a report should ideally meet:
- Intuitive and simple – The information and story provided by the report is clear and is focused on one topic.
- Comparable – The content is comparable in a timely manner or with other organizations.
- Process and action-related – The report must fit into the existing processes to find follow-up actions from the information provided.
- Visualized – A good, prepared visualization can tell a better story than unorganized tables and unformatted information.
- Flexible – Regulations and business needs are constantly changing so the reporting should be highly adjustable, allowing for dynamic reporting.
An integrated reporting solution will be key to provide full oversight and visualization. This can be achieved by using third-party applications or SAP reporting solutions like SAP Analytics Cloud (SAC), BusinessObjects or BW systems. By searching for an answer to connect third-party systems to SAP GRC, our team found three common challenges:
- Table structure complexity – SAP GRC uses an abstract table design to store the data. All objects’ data are contained in generic tables and are just temporarily aggregated for the user interface and don’t persist in the database. This means a considerable amount of effort was required to aggregate all relevant data for a report.
- Lack of interface solutions – the SAP GRC application server provides several interfaces and technologies to export data and make that data available on other systems. In the past, none of the interfaces provided were easy to adapt and were not reusable for the needed reporting requirements. With the newest release of SAP GRC and its integration of Fiori applications, new interfaces and technologies are available for communication to third-party systems.
- Authorization verification – SAP GRC uses a specific entity role concept leveraged by its internal reporting capabilities; however, it does not support any interface for third-party applications. In most cases, an authorization concept for the external reporting solution had to be developed and mirrored for effective reporting.
All these challenges are the major reason that effort and cost outweighed the benefits and value to this style of reporting. Therefore, most customers chose to leverage SAP GRC tabular reporting capabilities and export the data and information to Microsoft Excel, building in the visualization.
Protiviti’s data and analytics team developed a solution addressing these challenges, enabling a state-of-the-art visualization and dashboarding solution. The primary benefits are that the interface is based on the default reporting of SAP GRC providing configurable data selection combined with the authorization model of SAP GRC. The usage of an OData interface facilitates easy integration with most reporting technology available on the market.
Connection/interface
The first objective was to select a proper interface to consume the data for an SAP or third-party reporting applications. We analyzed several connectors and solutions and decided that an OData connection would give the most flexibility to interface with any reporting solution. Most of the modern visualization solutions support OData feeds and can be also leveraged for the development of Fiori applications and other SAP solutions.
Aggregation of data
One of the trickiest components of reporting is how to aggregate the data from the system and bring it into the correct format. The challenge in GRC is how the data is stored in the underlying tables. Developing an own aggregation-logic was not an option due to the high complexity, resulting in a significant amount of work combined with the risk of incompatibility for further releases. Thus, we decided to reuse the existing reporting framework for further data processing.
Enhancement and authorization
After the reporting framework was available, we enhanced the reporting with additional information and calculations via Core Data Services (CDS) views. An authorization check CDS view supports the verification of access for each user to an object in the system without Advanced Business Application Programming. This simplifies a secure data transfer. With this feature, the entire authorization concept of the GRC is maintained so that a user will see the appropriate data based on the authorizations in SAP GRC (e.g., a risk owner sees only the appropriated risks to which he is assigned).
Visualization
The ultimate result is an OData service that is consumable with any SAP solution, in particular SAP Analytics Cloud (SAC) or any third-party technology. SAC is the state-of-the-art reporting solution from SAP and is designed to serve as a central platform for enterprise-wide reporting. This allows silos to be broken down, and data and reports can be combined from different systems to gain new insights. The dashboard below is an example that combines existing report data enriched with new aspects.
All sections of the report are synchronized with each other, which means that filtered or selected data from one section also applies to other dashboards.
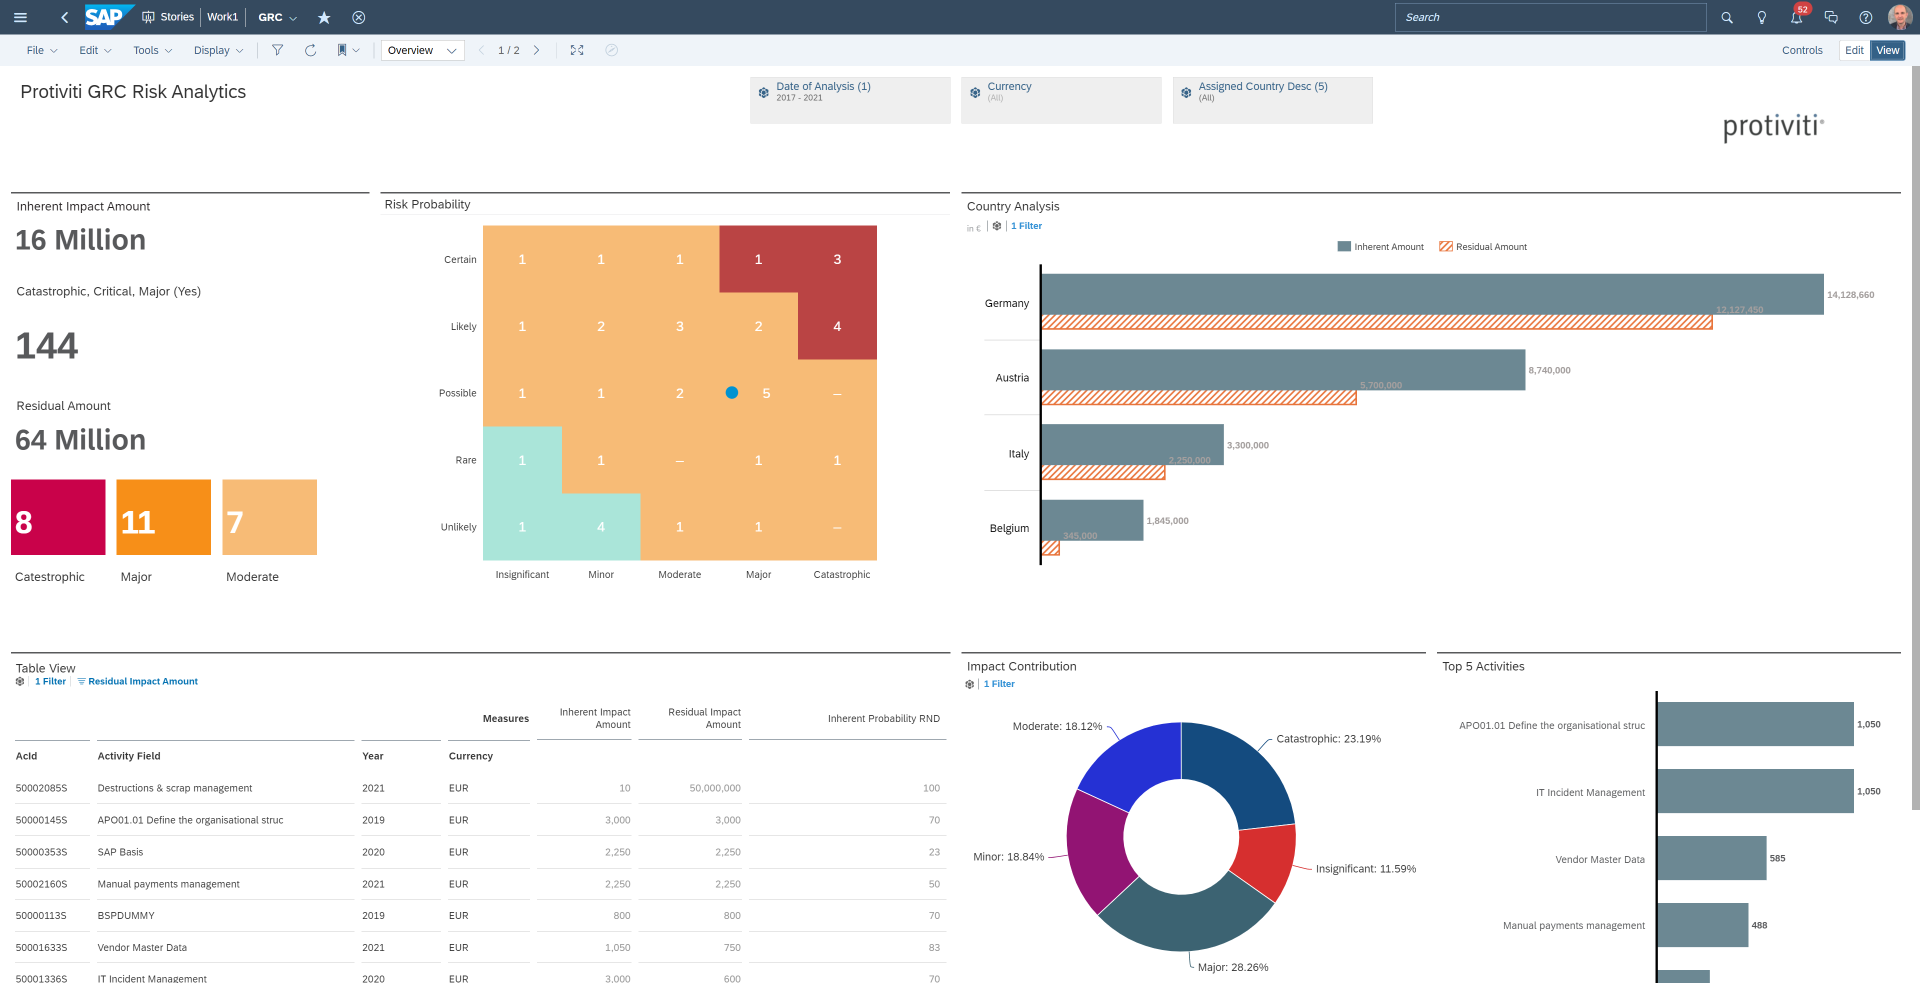
- Risk heatmap: Classical visualization of risks. Subdivision of the risks based on the criticality by the probability of occurrence and the impact of the risk on different levels.
- Risk distribution: Distribution of risks among the organizations of the company.
- Risk history: Graphical representation of how a risk increased and decreased over time.
- Overview table: Tabular representation of all risks with additional details currently selected.
This dashboard is only one example of the use of GRC data in SAC, providing an idea of the possibilities this tool provides. With more insights into an organization’s requirements, Protiviti can design a concept to address specific needs.
The latest version of SAP GRC enables the creation of custom reporting with many third-party applications. It is now possible to develop reporting without being limited by WebDynpro or the reporting framework of SAP GRC. In addition, we can combine large parts of the SAP GRC standard such as authorizations with developments in CDS views and OData services to minimize the effort needed for development and administration.
To learn more about our SAP consulting services, contact us.