
Earlier in 2021, Protiviti published a blog post titled Taking a Test Drive of SAP Analytics Cloud Report Design. In that blog, we discussed the ability to create paginated reports within the SAP Analytics Cloud (SAC) platform and made the argument for a hybrid approach to data visualization and transactional reporting with SAC and SAP BusinessObjects. While SAC has always been a data visualization platform, transactional reporting still has room for improvement. The blog demonstrated how SAP Analytics Cloud can be used to generate a transactional report with a traditional header and footer, exporting the report as a PDF to serve as a traditional transactional report. With SAC version 2021.16 (Quick Release Cycle) and in Q4 2021 for the Quarterly Release Cycle, these features are being improved with the ability to use repeating headers and footers, along with the introduction of margins within a transactional report. Let’s investigate these features in more detail.
Repeating headers and footers
This new update in the SAC platform provides the ability to build repeating headers and footers within a story. Previously, we could add a text box, some text, colors and logos or images to mimic the look of a header and a footer. These would show up at the beginning of the report and at the end of the report.
Now, select the report and go to the designer -> styling panel. At the bottom of the styling panel is the page layout section. This section now contains a toggle each for show header and show footer. Enabling these toggles will show the header and footer for the entire story. Recall that it is necessary to change the page size to fixed and set the size to letter and the orientation to portrait to give a traditional report look to the story.
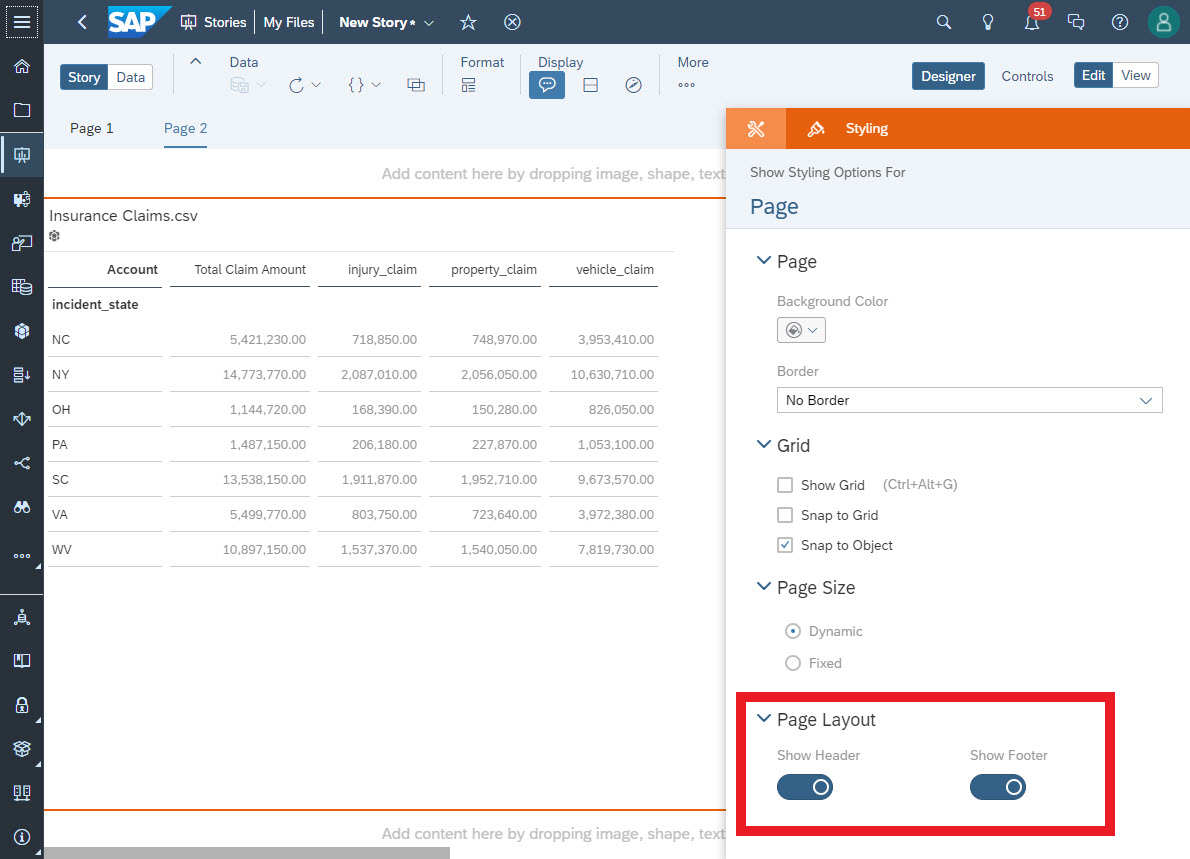
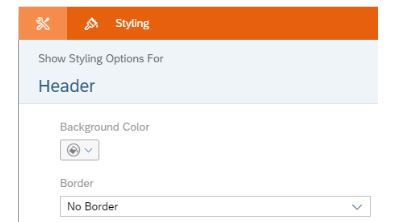
Now that the header and footer areas are shown, selecting the header gives the styling options that are available. Currently, we can change the background color and add borders in both headers and footers. The height of the header and footer can be adjusted individually by grabbing the handle on the bottom of the header and the top of the footer and moving it manually. It is not currently possible to do this numerically. Additionally, the headers and footers will show as the same on all pages. It is not currently possible to have a different header or footer for first and/or last pages as with the remainder of the report.
Page margins
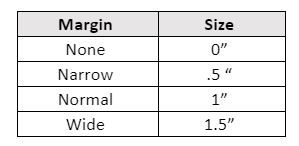
To provide a more polished look to the report, SAC now includes margins. Four options are available: none, normal, narrow and wide. Margin sizes are preset and cannot be modified. The options that are currently available give report designers the flexibility to deliver a report with the most popular layouts without having to manually modify the margin widths. The standard sizes are listed in the table below.
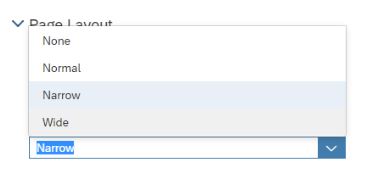
To change the margin, select the report area of the canvas and go to designer -> styling. The margins option is found at the bottom of the page in the page layout section. Selecting one of the options will adjust the story accordingly.
One design tip: Set the page size and margins before adding visualizations to the report. When margins are changed, SAC may prompt the page to be resized because the margins will potentially overlap existing visualizations. This could result in a page that is larger than a standard sheet of paper, preventing the content from appearing on a PDF or printed page as expected.
Next steps
This release is a great step forward in the development of paginated reports in the SAC platform. I am happy to see new features available, including the ability to repeat headers and footers, standard margins, etc. Exporting the document to a pdf creates a great looking paginated report, similar to what can be produced by other toolsets such as SAP Web Intelligence. There is still room for enhancement with respect to dynamic page numbers, different headers and footers on the first page and other adjustable margins. However, these updates mean the SAC platform is on the road to becoming a one-stop data and reporting visualization system.
To learn more about our SAP capabilities, contact us or visit Protiviti’s SAP consulting services.