A large food company had to meet several federal regulatory requirements for tracking refrigeration cylinders. To do so, they needed to be able to track and manage their inventory across multiple geographic locations and on their fleet of ships. The client approached our Protiviti On Demand Team to create a custom application that would accommodate their specific needs while staying within their current Microsoft 365 licensing.
Comprehensive solution
After discovery, our Protiviti team recommended utilizing the tools already available through the client’s current Microsoft 365 license and designed and developed a comprehensive solution that included:
- Microsoft SharePoint Online was used to interface with the data and as a repository for the inventory and transactions data.
- Microsoft PowerApps was leveraged to create a customized form to collect the data needed for different product transactions.
- Microsoft Power Automate was used to handle the logic of each transaction and appropriately update the refrigerant inventory.
- Microsoft Power BI was used to tie all the data together in visually appealing reports and dashboards, gaining insights into the inventory and transactions built using Power BI.
Automating the transaction process
A key goal of this initiative was to allow users within the organization to easily and efficiently record and track changes to the refrigerant inventory for their specific location. The final design was a web-based form, built in PowerApps, that could be accessed at any location with internet access. Refrigerant transactions are captured from the form, accounting for the acquisition, transfer and disposition of each container. A SharePoint list stores data on each transaction and PowerApps customizes the list to create an interactive form.
From a landing page, users select the type of transaction being performed. Depending on the type of transaction selected, different fields are shown on the form.
Adding inventory to a location
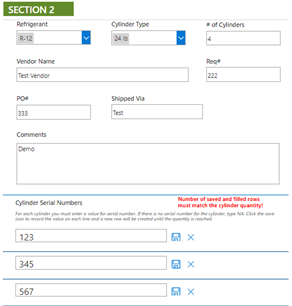
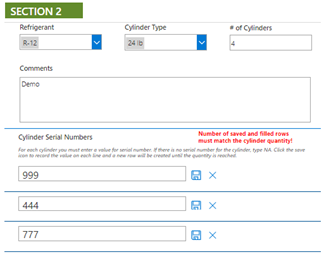
As inventory is added at a location, the form allows for entry of information for each container.
Purchase transactions
Non-purchase acquisition transaction
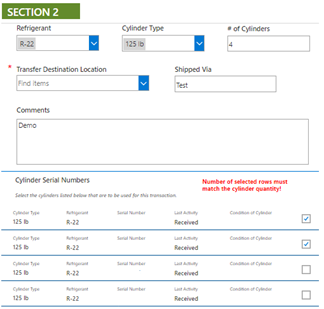
Transferring containers from a location
For transactions dealing with containers already in the location’s inventory (such as transferring a container), the appropriate containers are selected from a filtered display of containers that are registered to that location. To accomplish this, the Protiviti team took advantage of PowerApp’s ability to connect to other lists as data sources, create dynamic collections and display individual form controls for each container using galleries.
Logging the transactions
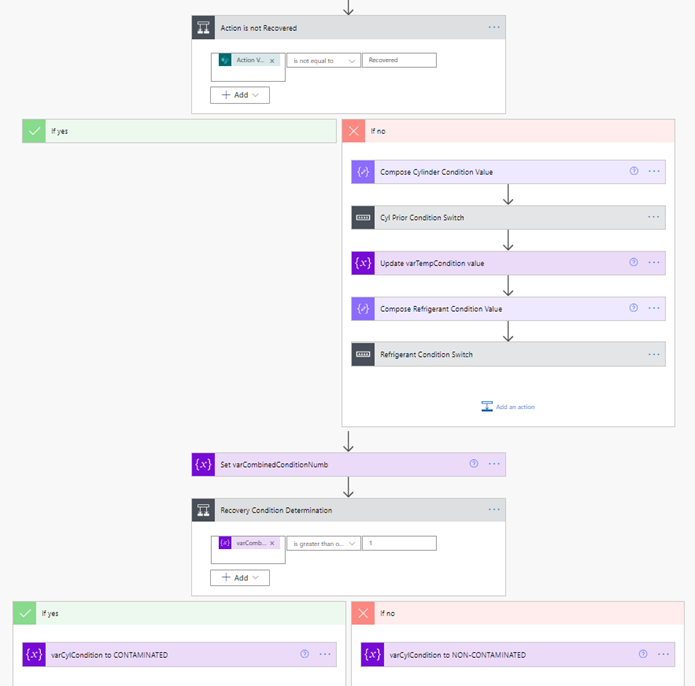
Once the refrigerant transactions are entered into SharePoint, Power Automate takes the stage. The designed flow processes each transaction separately to update the inventory in the SharePoint list. Depending on the type of transaction, the flow logic updates the inventory for the location specified in the transaction. As a result, the inventory for that location increases or decreases. The condition and contents of the containers identified in the transaction may also be updated from the form.
Snapshot of Power Automate flow
Once the flow is complete, the SharePoint inventory list will have an accurate accounting of the refrigerant for each location. Now, we can analyze the data with Power BI.
Reporting with Power BI
Data sources
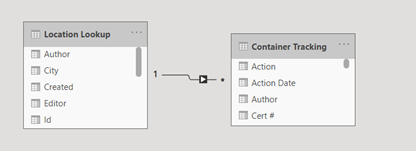
Using Power BI, we were able to report on the data captured in the process described above. Power BI is a great visualization tool that can bring together many data sources including SharePoint lists. In this case, we focused on two lists – location lookup and inventory tracking. Location lookup serves as a dimension table while inventory tracking is the heart of on the type of information the client wanted to gather.
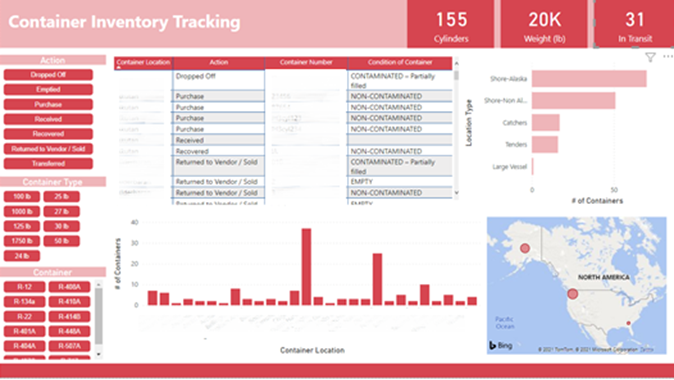
There were a few key metrics that were important to the business owners, such as the number of containers, the weight of containers and number of containers in transit. The number and weight of containers are based on outside filters like location or location type. However, the in-transit number would always stay the same regardless of filters. This was accomplished by creating measures in our data model to include/exclude certain filters.
Reviewing data
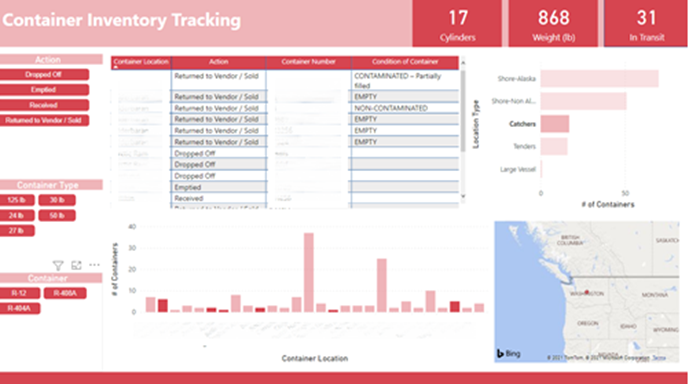
One of the many benefits of Power BI is its ability to slice and dice data. We can quickly see the total number of containers by location. If we were more interested in a particular location type, once selected, the rest of our data is shown as a mixture of filtered and highlighted.
Location details
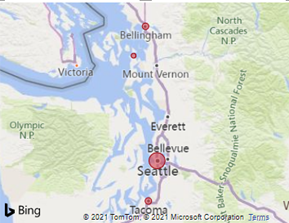
Power BI integrates seamlessly with Bing Maps since they are both Microsoft products. Business users can see a high-level view of locations and drill into a specific location to view more details. This feature works on a variety of location data and does not require specific latitude and longitude.
Location-based reports
While the first page is primarily focused on actions, the second report focuses more on location. We presented the users with an option to immediately drill down to a specific location. This page also shows some key metrics for a particular location such as total inventory, contaminated inventory and empty containers.
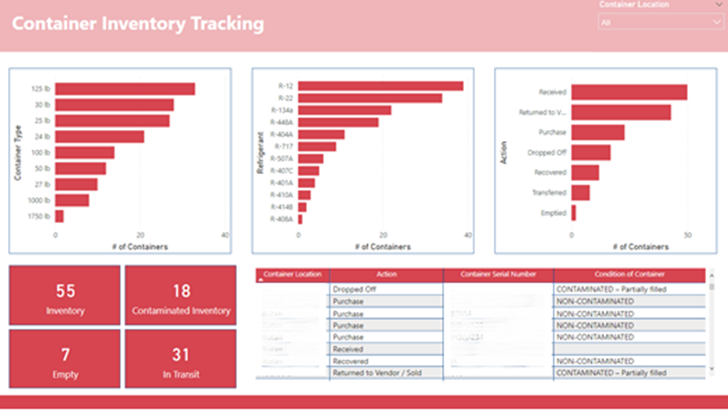
The interactions between visualizations makes Power BI so unique compared to previous reporting tools. In the example below, we can choose to look at container type, contents or action and see the other two filtered.


Valuable solution
Thanks to this new Power Platform solution, our client will have a more structured process in place, allowing them to easily input inventory changes and then track and report on that inventory at any given point, allowing them to meet a pivotal goal in achieving federal regulatory compliance. The new dashboard reporting will allow them to visualize the container locations and provides valuable insights from a high-level perspective. And, they will be able to reduce manual workload and increase the accuracy and accessibility of the data for this process.
To learn more about our Microsoft consulting solutions, contact us.


