
I have been working in data connectivity and visualization for over a decade and have spent countless hours building reports and dashboards to respond to a plethora of business needs. I have created operational reports for shop floor managers and financial dashboards for chief executives. If a position exists in an organization, I have developed some sort of visualization for that role. The process always begins with requirements gathering. “What is it that you’re trying to do?” and “How do you need this to look?” are typical questions that I ask. Looking for a response and furiously making notes, I begin the process of visualizing potential prototypes in my head. While this is a proven and repeatable process, I’ve learned there are more modern ways of getting actionable data from intelligent systems.
Looking at requirements gathering from a new perspective, I began to take the approach of “What questions are you trying to answer?” If I supplied the end users a system through which they could ask questions naturally, would that be more useful and successful? Extending traditional analytics development by asking real world questions speeds adoption by end users. This led me to the concept of augmented analytics. Do not let that pair of buzzwords be a deterrent. We hear about augmented analytics in numerous articles and publications on modern business intelligence practices. Many vendors have implemented their own take on augmented analytics. So, let’s have a look at how this topic in SAP Analytics Cloud (SAC) can help enhance and modernize current data visualization processes.
Introduction to Augmented Analytics
Augmented analytics is a process in which actionable insights can be derived using artificial intelligence and machine learning through simple interfaces such as natural language queries. To put it in simpler terms, ask a question and get an answer! All that is needed is a platform such as SAP Analytics Cloud and a good data model. The data model will have business terminology such as “sales revenue” and “patient count.” In a well-built model, users can ask questions such as “What is the sales revenue by region for last quarter?” or “What is the patient count for yesterday?” The system responds by reviewing all data models and objects within those models for names that match. The platform then supplies the most correct answer possible.
Preparing SAP Analytics Cloud for Questions
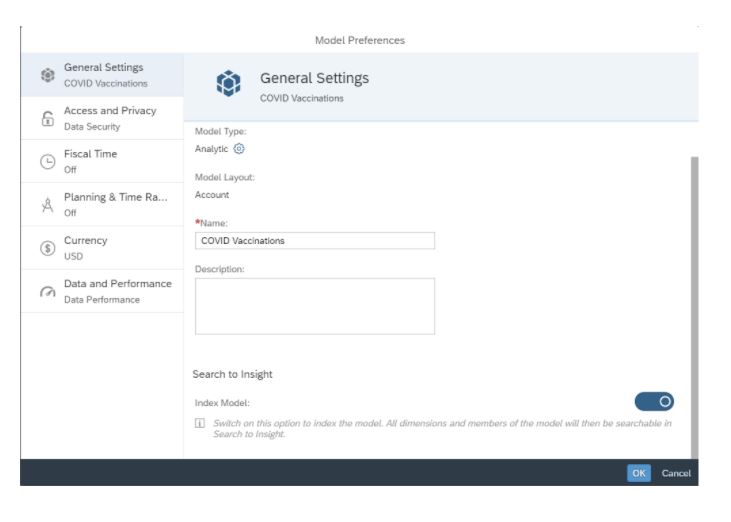
Here is a timely example of how SAP Analytics Cloud approaches augmented analytics through a feature called “search to insight.” We have a data set that has 1,267 records. Each record relates to the daily COVID-19 vaccinations by country. The data has been imported (this works for live connections as well) and the model has been prepared for analysis. To properly prepare the model, the measures and dimensions were named appropriately. For instance, rather than keeping a measure called “people_fully_vaccinated,” the field was named “People Fully Vaccinated.” This makes it easier for end users to find the information they need. Additionally, we need to index the model for “search to insight” queries (model -> model preferences -> search to insight -> index model).
Getting Actionable Information Through Questions
So far, we have found a data set and generated a model to help us gather actionable information. Now, we will use SAP Analytics Cloud to visualize the data. In SAC, there is a small light bulb icon at the top right corner. Clicking that icon opens the search to insight panel. At the bottom is a bar with the words “ask a question.” If we type a real question such as “how many people vaccinated yesterday?” we get a response:

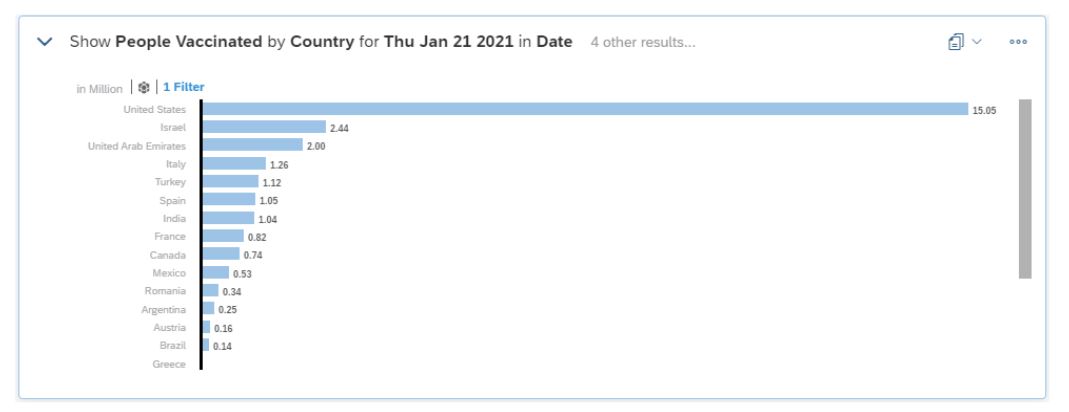
This response can be added to a new story or simply used to take action. Keep in mind that this data set reports on all vaccinations by day for all countries. Taking this a step further, we can query the number of vaccinations by country by issuing the query “people vaccinated yesterday by country”:
We can continue with more questions of the data such as “people vaccinated for USA by date”:
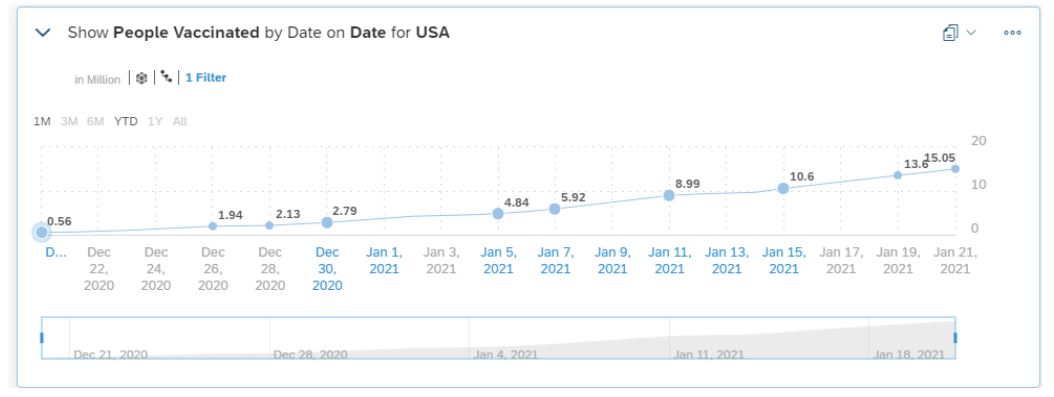
The platform presents us with a time series chart showing the number of people vaccinated only for the United States for all time within our data set.
Next Steps
Traditional development of data visualizations has always happened through the addition of widgets, then assigning the correct data to those widgets — a very technical method of visualization creation. With the latest features of SAP Analytics Cloud, end users will have the ability to visit a web–based platform to ask data related questions in business terms and receive the insights that they need when they need them. With a well-developed data model and an optimized database providing fast and accurate results, the adoption of these trusted systems will rise. The Search to Insight feature of the SAP Analytics Cloud platform supplies a very quick and powerful way to get timely information. This reduces the need for development bottlenecks and time to delivery. Consider how augmented analytics can help speed time to insight and have a look at the SAP Analytics Cloud platform to take advantage of these features.
To learn more about our SAP capabilities, contact us or visit Protiviti’s SAP consulting services.