


As a relatively new SAP analytics tool, the features SAP Analytics Cloud (SAC) offers are ever-evolving to benefit the end user. Earlier this year, SAP introduced an Excel add-in that allows companies to integrate their SAC analytic and planning models with Excel and explore data insights in the familiar spreadsheet tool. In this blog, we’ll look at how this new plug-in works and explain why it makes clients’ lives easier.
Why Use the Add-In?
SAP touts this new feature as a “playground…to plan, analyze, and simulate…data.” We see it as offering immediate benefits to clients who are looking to integrate Excel functionality into their SAC activity.
Indeed, the benefits are many. Users can create tables, based on one or several models, to an Excel workbook, providing additional flexibility during the reporting and planning processes. It supports bringing together data from spreadsheets, on-premise systems and the cloud.
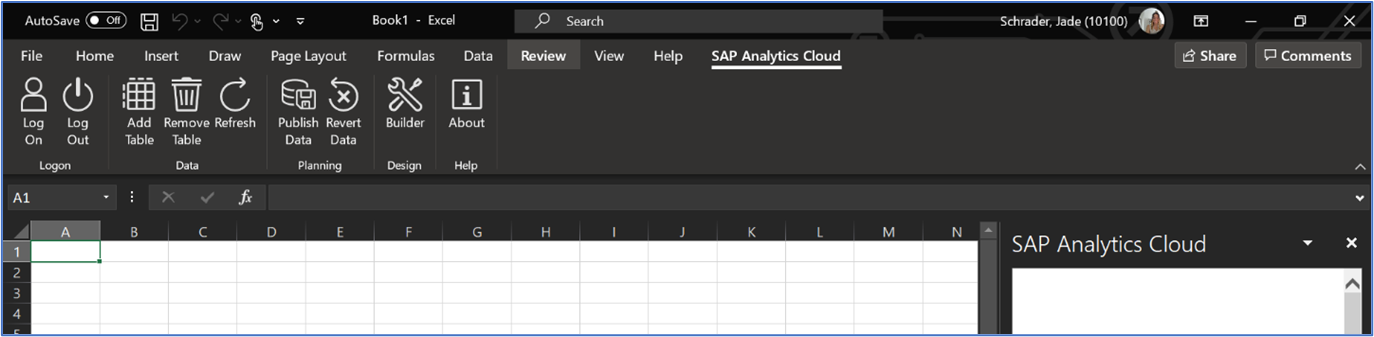
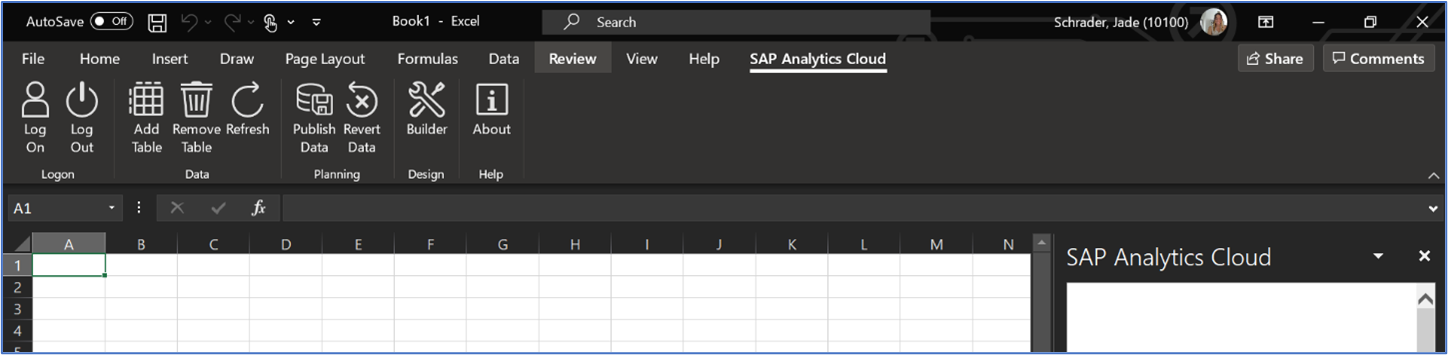
Any organization looking to analyze data with ease could benefit from the add-in; good candidates for deploying the add-in seamlessly are those that already have SAP tenants deployed on Cloud Foundry and a MS Office 365 license. After those prerequisites are met, it is as simple as accessing the SAP add-in from the Microsoft Office store and clicking Get It Now. It is a cloud download, so no .exe files need to be run. Once downloaded, the next time Excel is opened, an SAP Analytics Cloud tab will appear in the top ribbon.
Some other noteworthy features include being able to:
- Deepen analysis with pivots and Excel formulas
- Manipulate data from planning models and save different versions, revert it, and/or publish it back to the cloud
- Update tables in Excel with data from SAP Analytics Cloud at any time
- Share Excel workbooks with others and work collaboratively
- Bring together data from spreadsheets, on-premise systems and the cloud
- Insert one or several models into a workbook
How to Use the Add-In
Let’s take a look at how to use this new add-in. As an extension within the Excel application, where ‘SAP Analytics Cloud’ appears as a tab within the top ribbon after installation, users can simply open Excel, connect to the desired tenant and begin manipulating data.
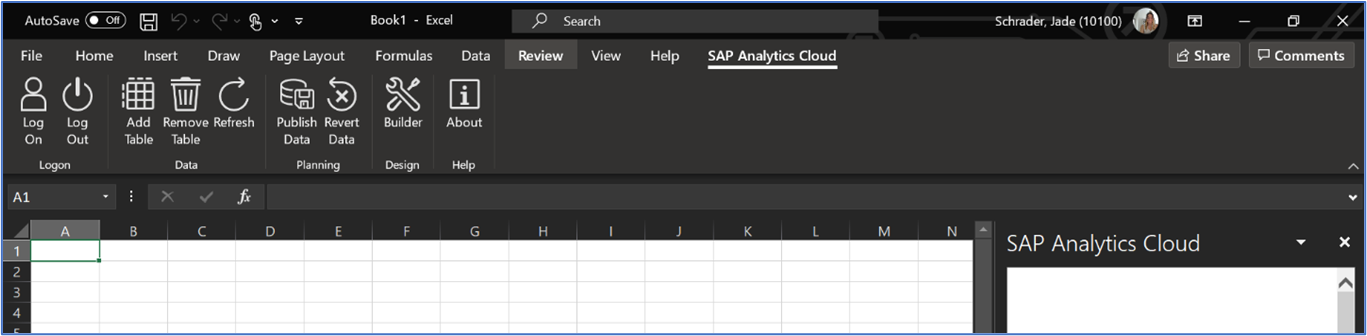
Upon opening the SAP Analytics Cloud tab in Excel, a user can hit the Log On button and easily connect to an existing SAC tenant. As the SAC tenant being accessed via the add-in already has data connections, there is no need for additional data source configuration within Excel. Just keep in mind that the SAP Analytics Cloud tenants used for the add-in must be based on SAP Cloud Platform (Cloud Foundry environment).
Both Mac and Windows environments support the add-in with Excel online or the desktop app. When working in either the online or app versions, the add-in is only active if the right-hand side SAP Analytics Cloud panel is open. Commands in the ribbon like Add Table and Refresh will be greyed out and will not work if the panel is closed.
If working in excel online and the SAP Analytics Cloud panel is showing as empty, check browser settings to see if third-party cookies are blocked. To use the add-in, third-party cookies must not be blocked by the browser.
From there, one can add and start customizing a table based on the chosen SAC model. Tables based on different models in the tenant a user is connected to can be added to the same workbook, however, after inserting the first model, it is no longer possible to change the tenant. To insert models of another tenant, open a new workbook and logon to the other tenant.
Customizing a table is as easy as adding or removing dimensions and measures as desired and using filters to slice and dice data. Total rows and columns can be applied to tables for quick summaries and analysis. If dimensions with hierarchies applied are added to an excel table, hierarchy nodes can be expanded or collapsed. Additionally, any proper excel functions or pivots can be utilized.
When working with data from a planning model in excel, users may save different versions of that data, either locally or to the cloud, or revert changes entirely. If one user makes a change to a planning model in excel, only they will be able to see the same change reflected in SAC. Only once that user hits Publish Data in the ribbon, will the changes display for all users accessing the planning model in SAC.
If a user is making changes to a planning model table in excel and does not want to publish those changes back to SAC, he can simply hit the Revert Data button in the ribbon and the table will refresh to its original state.
It is important to note is that users can only write planning model changes back to SAC; analytic model changes cannot be written back to SAC. If an organization is interested in keeping employees from being able to write back changes to SAC, the best practice would be to advise all employees to never publish their data and always revert it if they make any changes.
Users may update tables with actual data from SAC at any time, by simply hitting the refresh button in the top ribbon. In this way, the add-in supports accurate analysis at any point in the data lifecycle. Additionally, the Excel add-in does not fall victim to any data size limitations; in fact, users can access entire data models from Excel.
The largest intended use of the add-in is being able to further data manipulation and analysis via a well-known and widely understood technology, Excel. With that said, the add-in does not currently support accessing existing SAC reports. Instead, the add-in allows users to access raw SAC models to then build their own tailor-made tables. Keeping in mind that SAC is ever evolving their capabilities, being able to view or edit reports that were built in SAC within the Excel add-in may be included in a future release.
The add-in supports organizational collaboration in that workbooks can be shared with other users at any time. To enable other users to edit a workbook, select Allow Editing when prompted by the sharing feature. If a workbook is shared with other users and Allow Editing was not selected, the other users can only view the content, not the SAC ribbon. While SAP does not recommend using Excel’s co-authoring, which allows multiple users to work within a workbook at the same time, it is possible to do so.
The capabilities of the add-in are rich, and with continuous improvements introduced by SAP, is only bound to get richer, giving companies looking for simple and cohesive analytics a well-deserved analytics option.
To learn more about our SAP capabilities, contact us or visit Protiviti’s SAP consulting services.