The concept of achieving effective data-driven risk management may sound intimidating, but ultimately, it’s about organizations trying to make well-informed business decisions using their available data and subject matter expertise. Unfortunately, many of the ways that organizations measure and execute against risk fail to quantify and frame the risk challenges in a way that decision makers can be sure they are making the right decision. Decision makers need a concrete model with clear definitions to enable measurement, comparison and ultimately, informed decisions. These steps lead to effective risk management that aligns with organizational goals and priorities.
In our work with clients, we see most are aiming to make risk decisions based on objective data that is defensible and meaningful. In fact, in a recent webinar we conducted on this topic, over 90 percent of the audience told us they currently make important business decisions based on data.
Decisions, decisions
There are two sides of the risk data measurement coin: risk data, that tells us about the risk the organization is facing and performance data, which is based on a company’s ability to monitor processes and understand how well those processes are working. Additionally, there is a decision to be made between qualitative and quantitative methods. Qualitative methods have their place within risk management organizations, but there is danger when mixing qualitative and quantitative methods. We call these “pseudo-quantitative” methods.
If or when organizations introduce quantitative risk management measurement into their existing qualitative risk management programs there are four common main problems that should be considered that collectively are called “pseudo-quantitative methods.” They are:
- Fake math
- Range compression
- Inability to aggregate risk
- Inability to communicate risk
It’s important to remember that just because you’ve assigned numbers to risk doesn’t mean you can do math with these numbers. Put another way: just because assigned numbers or labels have been assigned to risk, does not mean that risk can be solved. Labels are not numbers and ranking can be completely arbitrary.
Process Makes Perfect
Effective risk management programs use a defined, repeatable process to derive meaningful metrics that directly support an organization’s objectives. More often than not, most metrics programs use metrics that are available but not meaningful. Using data to align cyber risk to business risk is important and we can measure things even without a full 360 degree perspective on the data. The goal should be to reduce uncertainty to an agreeable level so business leaders can make informed decisions. With range-based estimates, we can begin to do analysis and determine likely risk scenarios. We can accomplish this with basic tools like an Excel spreadsheet, or utilize software tailored specifically for this purpose.

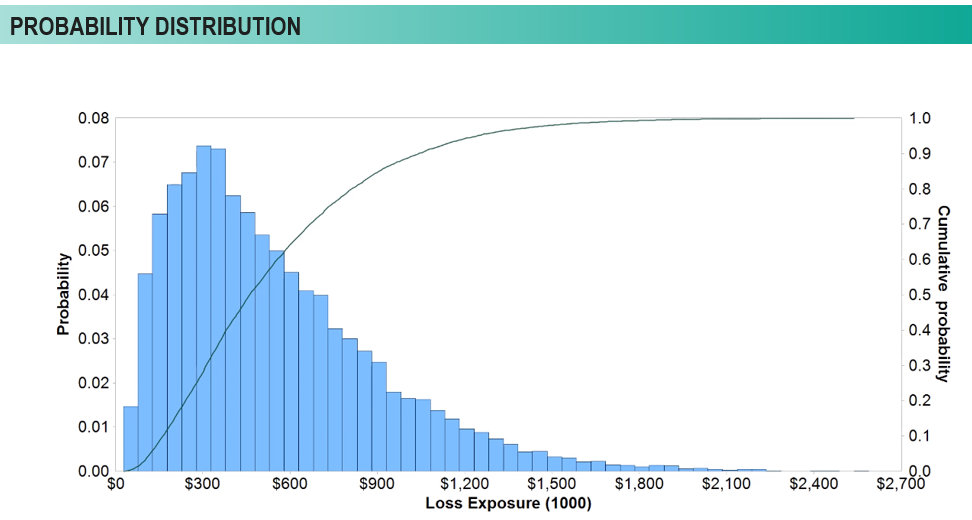
Let’s take a look at how we then use range-based estimates to estimate loss or risk probability. This histogram helps us understand what we are looking at. The blue bars are plotting the relative frequency, or the probability, that the particular losses occurred across the bottom axis. So, the taller the bar, the more likely it is, in a given year, to have that amount of loss exposure. And then we can plot what is called a cumulative function, represented by the line rising across the chart. This tells us what the cumulative result is, which allows us to look at this chart and say that 80% of the losses that we would expect to occur from this scenario would be less than $800,000 of exposure.
Now, we have useful measures and information that the organization can use to begin making decisions. We can understand loss exposure and determine whether the organization is comfortable with that amount of exposure. If not, the organization now can determine how much to spend to remediate that exposure level. Let’s say our client is uncomfortable with this level of risk. We can then implement additional controls to improve that comfort level. Then, we can adjust data inputs and can say, for example, instead of losing one to 12 laptops in a year that have sensitive information on them, what if we encrypt those laptop with BitLocker, and there’s a less likely chance of experiencing a loss. If we remodel the scenario, we can refine the ranges, rerun the simulations and compare results. This allows us to quantify the return on investment, or the return on control, for a particular initiative. We are using data in a very simplistic way, calibrating our findings with the organization’s subject matter experts, and turning that into information that the business can use to make these decisions business decisions, not necessarily just technology decisions.
Conclusion
Using data to align cybersecurity to the business is important. Commonly, there is a gap between the data presented and what is usable to the business. Being able to translate the data coming out of operational tools and processes into business goals and outcomes is key. While most companies feel they do not have enough data, the reality is that an organization can use quantitative analysis techniques to effectively make business decisions with subject matter expertise. When it comes to performance, aligning the metrics to organizational goals ensures that the metrics reported and collected are valuable, useful to the business and cost effective.
To view the complete webinar, Data Driven Security: Using Data to Make Informed Business Decisions, click here.


